Debugging Lua scripts
When a script reaches a certain complexity it becomes more and more difficult to determine what exactly that script does. Finding errors can be done by using "ba.print" statements to log the values of certain variables at runtime but that is a crude way of figuring things out.
Fortunately, Lua provides some basic building blocks for implementing an interactive debugger where you can tell it to stop the program at a certain point, take a look at variable values, and stepping to the next execution line.
This page will explain how to set that up for debugging Lua script in FSO.
EmmyLua
This is a useful suite of plugins that allows both to do interactive debugging and having enhanced code assistance if configured correctly. There are two variants, one for the IntelliJ family of IDEs and one for VisualStudio Code.
IntelliJ plugin
Installing the plugin is as easy as going to the plugin page in the settings and searching for "EmmyLua". Restart the IDE and you are good to go.
Project setup
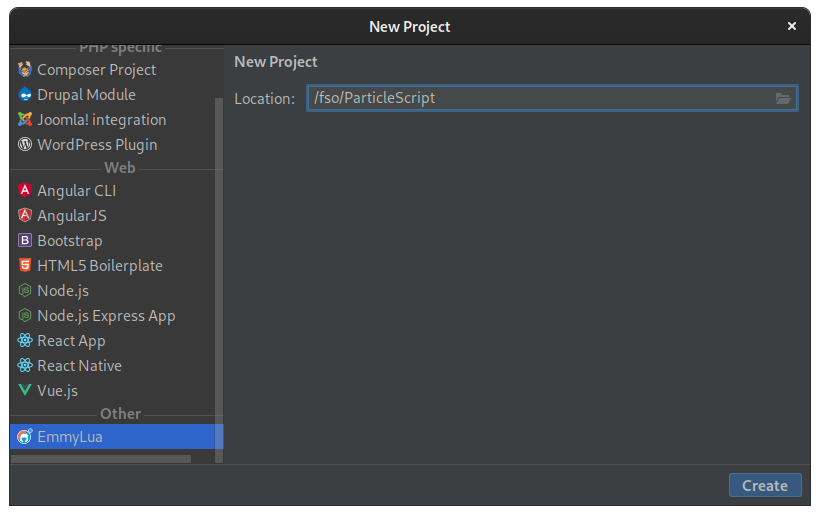
Select the "EmmyLua" type under the "Other" section and enter the path to your mod folder:
That is enough and you should now see your mod project including your scripts. Since EmmyLua has no idea about our special scripting tables, this would be a good point to either use a standalone script file or to separate your script into a Lua module so that you can work with pure .lua files. EmmyLua can also use the API definitions generated by FSO to give you more assistance with the FSO scripting API. Simply use the tool from this thread to generate the API definition for the plugin to use.
Debugging setup
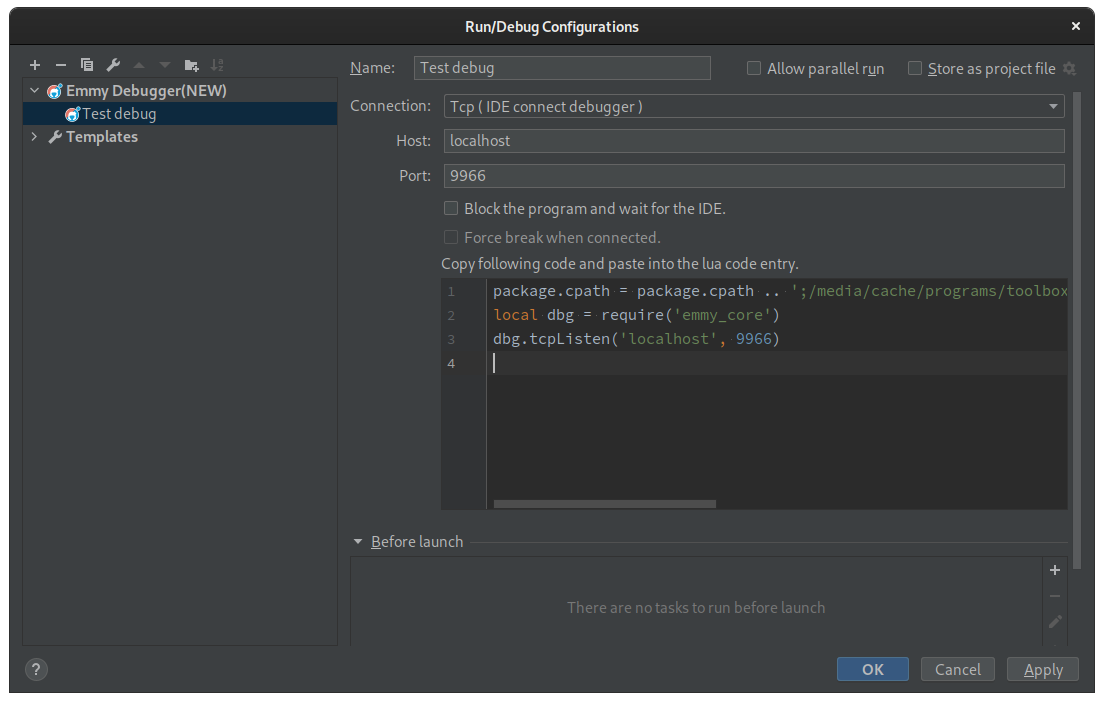
Now that you have your project, you can click "Add configurations..." in the top left corner. Click the small "+" and select "Emmy Debugger(NEW)" (name might have changed by the time you read this but it should still be similar):
The two relevant items here are the "Connection" value and the script the IDE shows you. Since the debugger works by doing some (local) network communication you need to specify in which order the debugger and FSO will be launched. If you select "Tcp (IDE connect debugger)" then you need to launch FSO first and then launch the debugging session. "Tcp (Debugger connect IDE)" is the reverse, there you first need to launch the debugger configuration and then launch FSO. Choose whichever works better for you. For advanced users, you can also create a combined launch configuration that automatically launches FSO as well but that will not be covered here.
Now that you have chosen, simply copy the script the IDE displays to you and place it as "zzzdebugger-sct.lua" in your data/tables folder. The weird name ensures that the script will be executed first before any other script and will allow you to debug all Lua code that you have in your mod. Please not that this script is specific to your machine and will also break your mod if there is no debugger on the system so it should neither be checked into Git/SVN (if you have that) or included in the final mod release.
And now you are done. Set breakpoints where you would like the debugger to halt. Breakpoints can be placed by clicking to the right of the line numbers and a visual indicator will show that a breakpoint now exists there and if your script reaches that point execution will suspend and you can look at both local and global variables.

